
Existing Franchises for Sale: 2026 Market Data on Prices, Cash Flow & Multiples
Most buyers only see the businesses that make it to the open market. Verified Franchise Resales' 2026 estimate range is that just 15% to 25% of U.S. franchise unit transfers are publicly listed for sale, based on FRANdata's 2024 transfer-rate benchmark and the 5,692 publicly listed existing franchises for sale observed in this study; the estimate is directional and is not a measured transaction share.
That means a large share of ownership changes likely happen out of public view, including transfers to existing franchisees, managers or family members, buyers sourced through the franchisor, and buyers reached through private sale processes.
The visible market has its own problem: not every business advertised as an existing franchise for sale is actually a comparable franchise resale. Verified Franchise Resales screened publicly available listing information from June through September 2026 and removed duplicates, independent businesses, development advertisements, routes, template-style records and other non-comparable opportunities before analyzing 5,692 publicly listed existing franchises for sale.
Of those 5,692 publicly listed existing franchises for sale in 2026, 3,048 disclosed both annual revenue and annual cash flow, creating the core sample used for comparable financial analysis throughout this report.
Key Findings
- Verified Franchise Resales analyzed 5,692 publicly listed existing franchises for sale in the U.S. from June through September 2026 after removing duplicate and non-comparable records.
- The median asking price for an existing franchise for sale in the U.S. was $325,000 in 2026, based on 2,980 listings that disclosed revenue, cash flow and an asking price.
- The median existing franchise for sale in 2026 reported $655,478 in annual revenue and $124,592 in annual cash flow, based on 3,048 listings that disclosed both figures.
- The median asking-price-to-cash-flow multiple for an existing franchise for sale in 2026 was 2.81x, based on 2,957 listings with a calculable multiple.
- Among 2026 listings with calculable cash-flow multiples, owner-direct listings asked 2.79x cash flow (n = 501) and broker listings asked 2.80x (n = 2,285); among listings with calculable revenue multiples, owner-direct listings asked 0.55x revenue (n = 506) versus 0.50x for broker listings (n = 2,294).
- Seller financing was advertised on 24% of existing franchises for sale that disclosed both revenue and cash flow in 2026, or 726 of 3,048 listings; the rate was 31% for owner-direct listings (n = 521) and 22% for broker listings (n = 2,336).
- Retirement was the most common stated reason for selling an existing franchise in 2026, appearing on 26% of the 2,728 listings that stated a reason for sale.
- The median existing franchise for sale in 2026 had been established for 8 years, based on 2,581 listings that disclosed a year established.
- Asking multiples increased with business size in 2026: existing franchises with $100,000 to $249,999 in annual cash flow asked a median 2.64x (n = 1,128 calculable multiples), while those with $750,000 or more asked 3.80x (n = 117 calculable multiples).
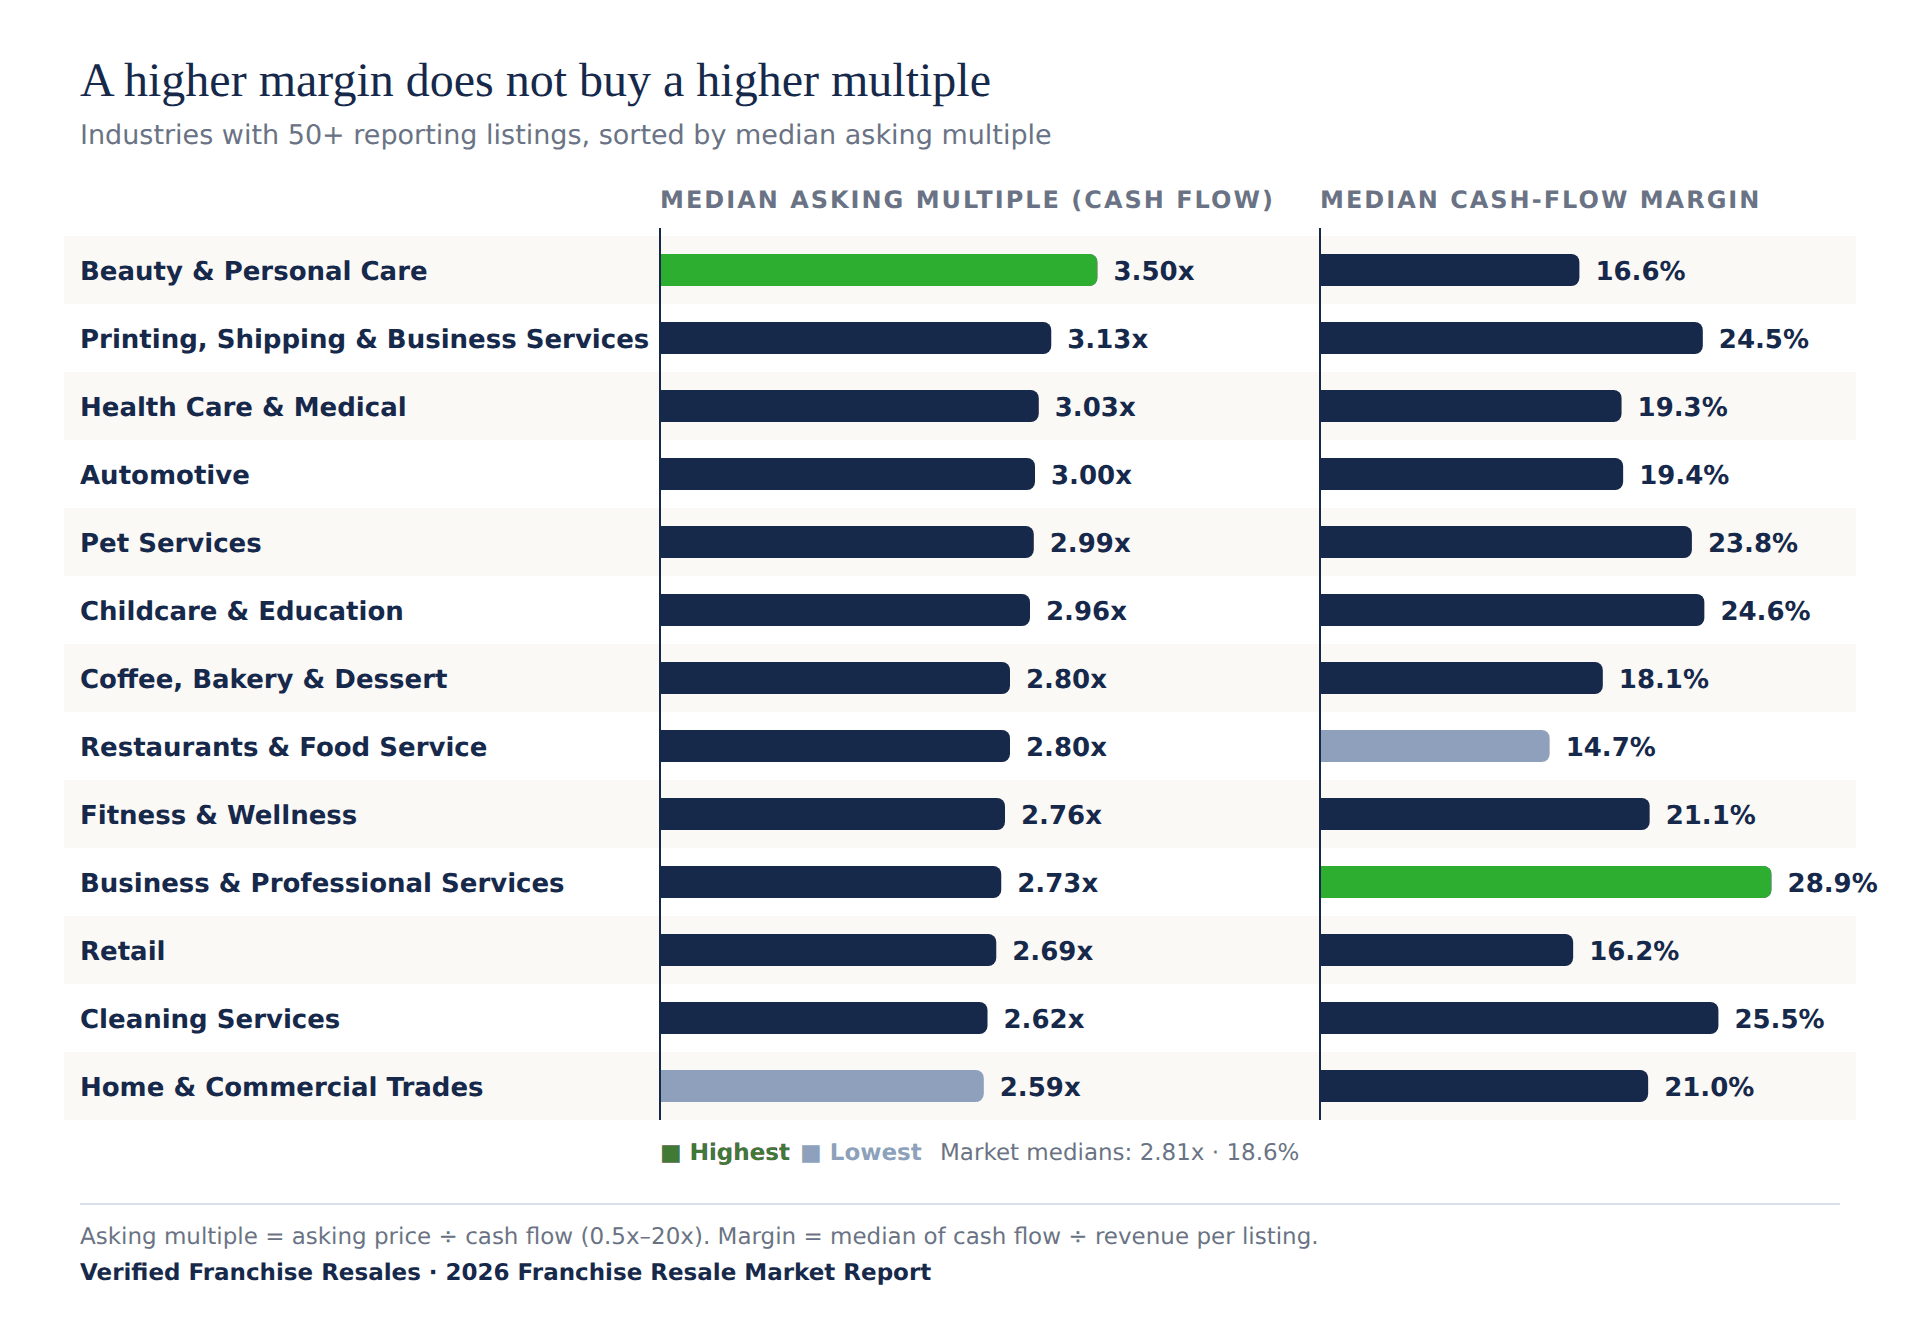
- Among industries with at least 50 calculable cash-flow multiples in 2026, Beauty & Personal Care had the highest median asking multiple at 3.50x (n = 88), while Home & Commercial Trades had the lowest at 2.59x (n = 416).
- Among 2,300 existing-franchise listings observed more than once in 2026, 18% reduced their asking price, and the 404 listings that cut price reduced it by a median 17%.
- Verified Franchise Resales' 2026 estimate range is that 15% to 25% of U.S. franchise unit transfers are publicly listed for sale, based on FRANdata's 2024 transfer-rate benchmark and the 5,692 publicly listed existing franchises for sale observed in this study; this is an estimate, not a measured transaction share.
What does the 2026 data say about existing franchises for sale?
The typical existing franchise for sale is not a million-dollar business. Most of the market sits well below that level, and most reporting businesses generate less than $250,000 a year in cash flow.
The more interesting pattern is what happens as earnings rise. Larger businesses do not simply cost more; sellers generally ask more for each dollar of cash flow. Industry matters too, but business size explains more of the pricing spread than most industry labels do.
The data also shows how the market is actually presented to buyers: owner-direct listings look different from broker listings, seller financing appears regularly, retirement is the most common stated reason for selling, and many listings change price or leave the market within a few months.
How many existing franchises are listed for sale in the U.S.?
Verified Franchise Resales analyzed 5,692 publicly listed existing franchises for sale in the U.S. from June through September 2026 after removing duplicate and non-comparable records.
The public market is only part of the ownership-transfer market. Verified Franchise Resales' 2026 estimate range is that 15% to 25% of U.S. franchise unit transfers are publicly listed for sale, based on FRANdata's 2024 transfer-rate benchmark and the 5,692 publicly listed existing franchises for sale observed in this study; the full logic appears in What percentage of franchise transfers are publicly listed for sale?
Among the 3,048 listings that disclosed both revenue and cash flow in 2026, Restaurants & Food Service represented 909 listings and Coffee, Bakery & Dessert represented 416 listings, so the two food industries together accounted for 43% of the core comparative sample.
Among the 3,048 listings that disclosed both revenue and cash flow in 2026, Home & Commercial Trades was the largest non-food industry with 434 listings.
What percentage of franchise transfers are publicly listed for sale?
No industry body publishes a measured split between private franchise transfers and franchise transfers that are publicly listed for sale, so Verified Franchise Resales treats its 2026 public-market share as an estimate range, not a measured transaction statistic.
Verified Franchise Resales' 2026 estimate range is that 15% to 25% of U.S. franchise unit transfers are publicly listed for sale, based on FRANdata's 2024 transfer-rate benchmark, the national franchise-establishment count cited by IFA/FRANdata, and the 5,692 publicly listed existing franchises for sale observed in this study.
FRANdata's reported 4.1% franchise-unit transfer rate for 2024 is used only to estimate the total number of annual ownership changes—the denominator in the comparison—and does not indicate whether any individual transfer was marketed publicly or privately.
Franchisor survey data points in the same direction: Franchise Update's 2024 Annual Franchise Development Report said 69% of surveyed franchisors used existing franchisees as a source of buyers for transferred units and 61% operated a formal program for handling transfers; those percentages describe franchisor practices, not the share of individual deals.
FRANdata reported that multi-unit operators controlled 56% of franchised units in the cited 2024 research, which helps explain why existing operators can be a large source of buyers when a franchise owner exits, but that figure also does not measure the private-versus-public split.
Whether privately transferred franchise units differ from publicly listed existing franchises for sale in size, quality, pricing or profitability cannot be determined from the 2026 dataset.
How much does it cost to buy an existing franchise?
The median asking price for an existing franchise for sale in the U.S. was $325,000 in 2026, based on 2,980 listings that disclosed revenue, cash flow and an asking price.
The takeaway: Most publicly listed existing franchises for sale are small-business acquisitions, not seven-figure deals.
Among the 2,980 priced listings in 2026, 68% asked $500,000 or less, while 14% asked $1 million or more.
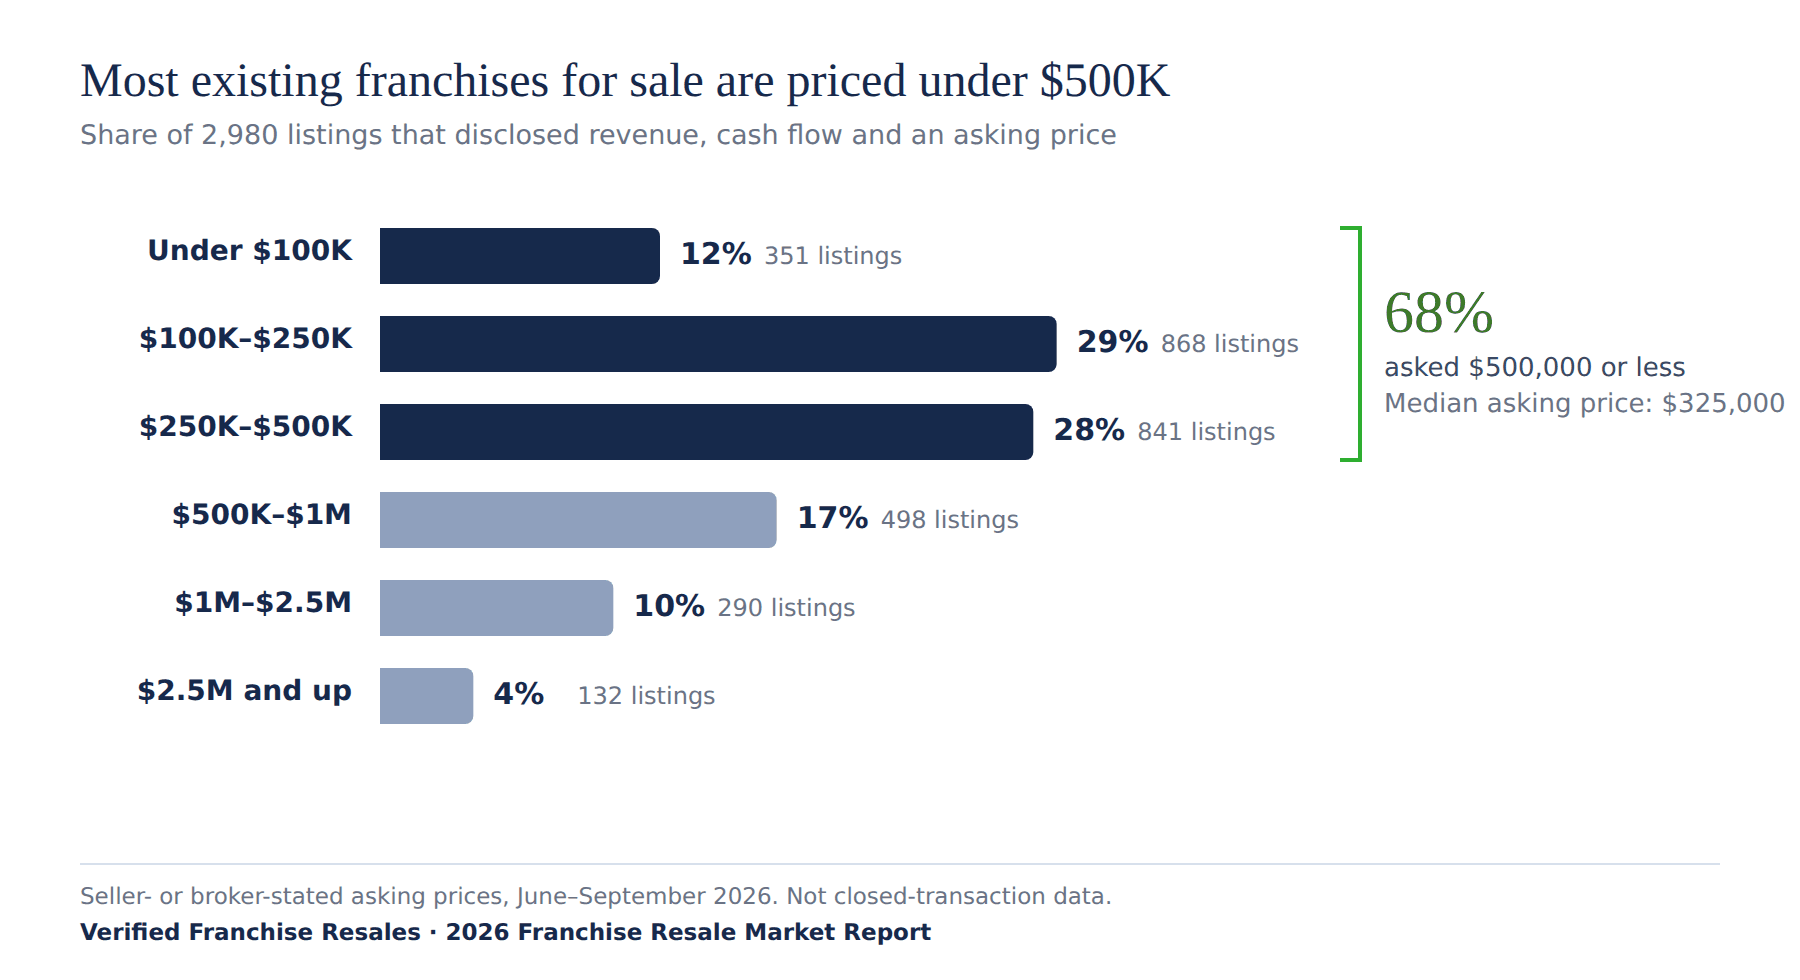
| Asking price | Listings | Share of listings |
|---|---|---|
| Under $100K | 351 | 12% |
| $100K–$250K | 868 | 29% |
| $250K–$500K | 841 | 28% |
| $500K–$1M | 498 | 17% |
| $1M–$2.5M | 290 | 10% |
| $2.5M and up | 132 | 4% |
Real estate is usually not part of the deal: 72% of the 3,048 reporting listings in 2026 explicitly operated from leased premises, while 4% included owned real estate.
The median existing franchise for sale in 2026 reported 7 employees, based on 1,124 listings that disclosed an employee count.
How many existing franchises for sale cost less than $500,000?
In 2026, 68% of the 2,980 publicly listed existing franchises for sale in this study that disclosed revenue, cash flow and an asking price were priced at $500,000 or less.
The takeaway: Most publicly listed existing franchises in the reporting sample were priced below $500,000, which makes the market much broader than the seven-figure transactions that often get the most attention.
Can you buy an existing franchise for under $250,000?
Yes. In 2026, 39% of the 2,980 reporting listings with an asking price were priced below $250,000.
Can you buy an existing franchise for under $500,000?
Yes. In 2026, 68% of the 2,980 reporting listings with an asking price were priced at $500,000 or less.
The full asking-price distribution appears in the asking-price section above.
How much revenue and cash flow do existing franchises for sale generate?
The median existing franchise for sale in 2026 reported $655,478 in annual revenue and $124,592 in annual cash flow, based on 3,048 listings that disclosed both figures.
The takeaway: Revenue tells you the size of the operation; cash flow tells you far more about what the owner may actually be buying.
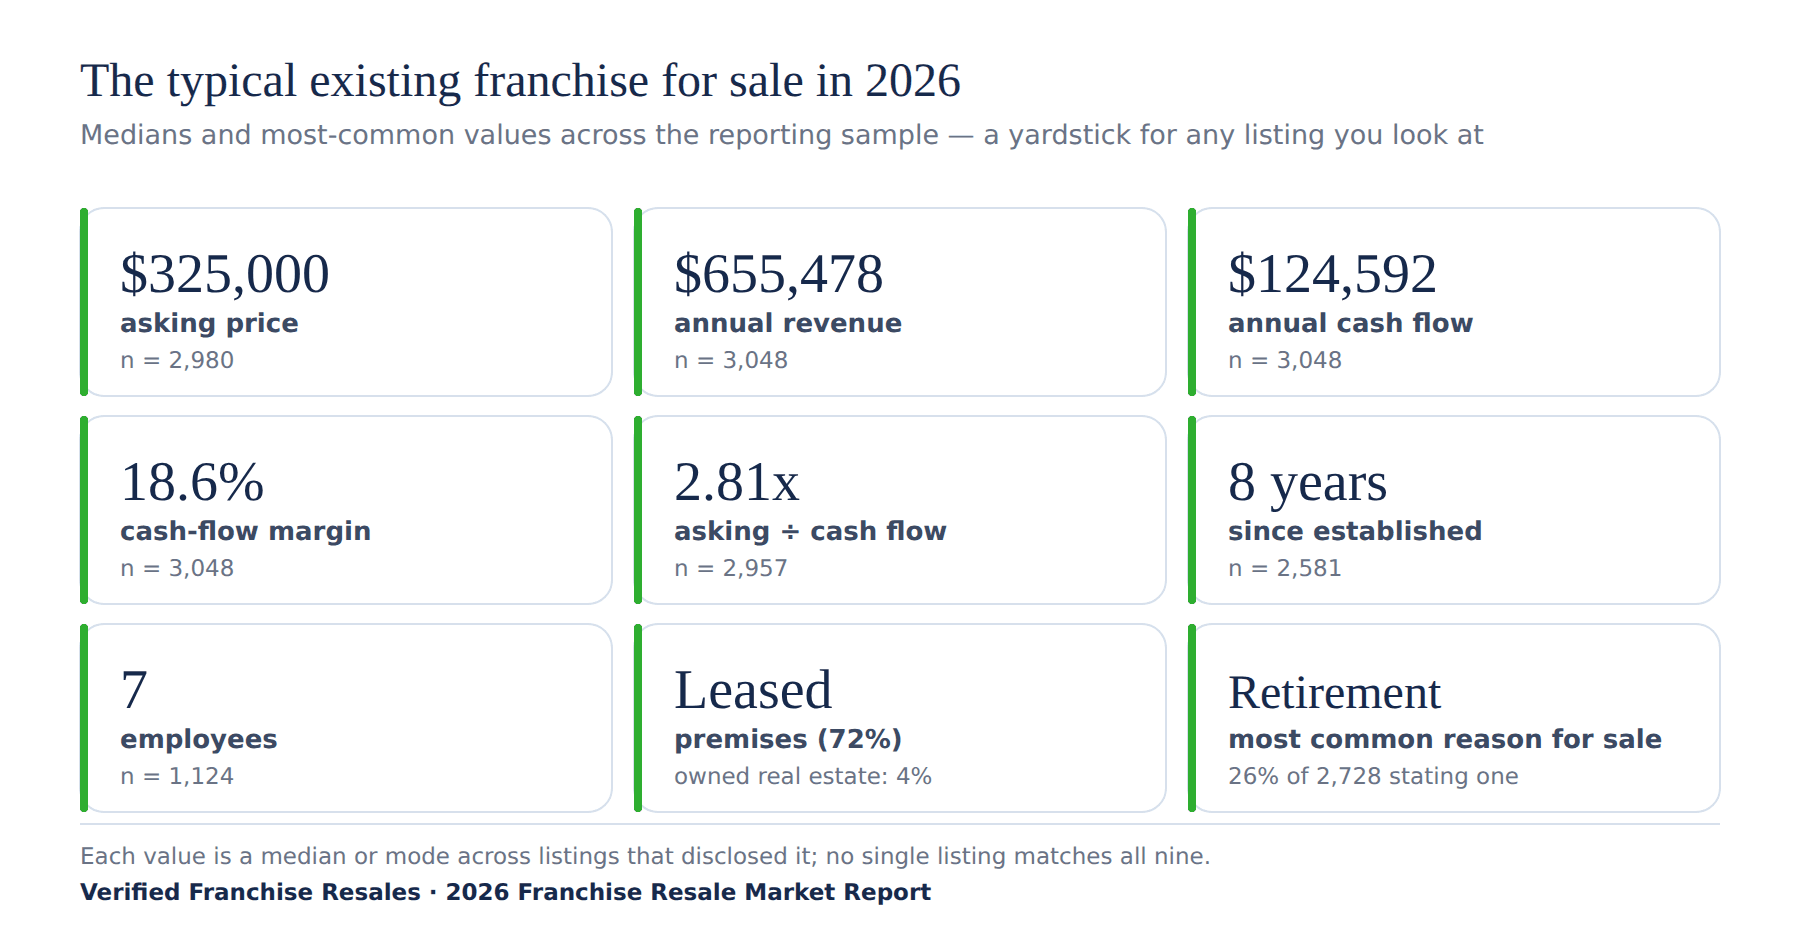
The median cash-flow margin for existing franchises for sale in 2026 was 18.6%, based on the same 3,048 listings, and half of those listings reported annual cash flow between $70,037 and $225,000.
For this report, cash flow means the earnings figure stated in the listing: seller's discretionary earnings in most cases and EBITDA in a minority of larger listings.
Among all 5,692 publicly listed existing franchises for sale observed in 2026, 79% disclosed revenue, 56% disclosed cash flow, 54% disclosed both, and 18% disclosed neither; the core comparative sample therefore represents the financially transparent portion of the public market rather than every business advertised for sale.
How much should I pay for an existing franchise?
The median asking-price-to-cash-flow multiple for an existing franchise for sale in 2026 was 2.81x, based on 2,957 listings with a calculable multiple.
The takeaway: About 2.8x cash flow is a useful market benchmark, but the right comparison depends heavily on business size.
What is a typical cash flow multiple for an existing franchise?
The middle half of those 2,957 listings in 2026 asked between 2.14x and 3.66x cash flow, which means a 4.0x asking multiple sat above roughly three-quarters of the market and a 2.0x asking multiple sat below roughly three-quarters of the market.
The median asking price for an existing franchise for sale in 2026 was 0.51x annual revenue, based on 2,972 listings with a calculable revenue multiple.
These are asking multiples, not closed-sale multiples, so they show how sellers positioned businesses in the market rather than what buyers ultimately paid.
Are franchises for sale by owner (FSBO) priced lower than broker listings?
Not per dollar of earnings: among 2026 listings with calculable cash-flow multiples, owner-direct listings asked a median 2.79x cash flow (n = 501) and broker listings asked 2.80x (n = 2,285).
The takeaway: Owner-direct businesses are usually smaller, but owners are not necessarily asking less for each dollar of earnings.
Owner-direct listings did have a lower median asking price in 2026—$299,000 versus $325,000 for broker listings—because the owner-direct businesses were smaller, with median revenue of $530,000 versus $697,270 for broker-listed businesses in the core comparative sample.
Measured against revenue, owner-direct listings actually asked more in 2026: 0.55x annual revenue among 506 calculable owner-direct listings versus 0.50x among 2,294 calculable broker listings.
| Listed by | Listings | Share of listings | Median revenue | Median cash flow | Cash flow % of revenue | Median asking price | Median asking multiple (cash flow) | Median asking multiple (revenue) |
|---|---|---|---|---|---|---|---|---|
| Business broker | 2,336 | 76.6% | $697K | $128K | 18.2% | $325K | 2.80x | 0.50x |
| Owner-direct (FSBO) | 521 | 17.1% | $530K | $106K | 21.0% | $299K | 2.79x | 0.55x |
| Franchisor | 92 | 3.0% | $641K | $106K | 18.2% | $345K | 3.20x | 0.59x |
| Annual revenue | Broker listings | n | Owner-direct listings | n |
|---|---|---|---|---|
| Under $250,000 | 0.66x | 228 | 0.74x | 101 |
| $250,000–$500,000 | 0.50x | 564 | 0.54x | 136 |
| $500,000–$1,000,000 | 0.47x | 770 | 0.50x | 158 |
| $1,000,000 and up | 0.49x | 732 | 0.54x | 111 |
Among the 3,048 listings that disclosed both revenue and cash flow in 2026, business brokers listed 2,336 businesses, or 77%; owners listed 521 businesses directly, or 17%; franchisors posted at least 92 businesses, or 3%; and 99 listings could not be classified.
Among all publicly listed existing franchises for sale observed in 2026, owner-direct businesses were a larger share of inventory than they were in the core comparative sample because owners disclosed both revenue and cash flow only 38% of the time, compared with 63% for broker-listed businesses.
The data supports two possible explanations for the higher owner-direct revenue multiple: owners may anchor to a price a broker would have adjusted, or owner-reported revenue may be less rigorously screened before publication. The listing data cannot determine which explanation is correct.
How common is seller financing when buying an existing franchise?
Seller financing was advertised on 24% of existing franchises for sale that disclosed both revenue and cash flow in 2026, or 726 of 3,048 listings.
The takeaway: Seller financing appears often enough that buyers should not assume every acquisition must be funded entirely with cash or a lender.
Seller financing was advertised on 31% of owner-direct listings in 2026 (n = 521), compared with 22% of broker listings (n = 2,336) and 21% of identifiable franchisor listings (n = 92).
SBA financing showed up as a separate path as well: 255 of the 3,048 reporting listings in 2026, or 8%, referenced SBA financing or SBA pre-qualification.
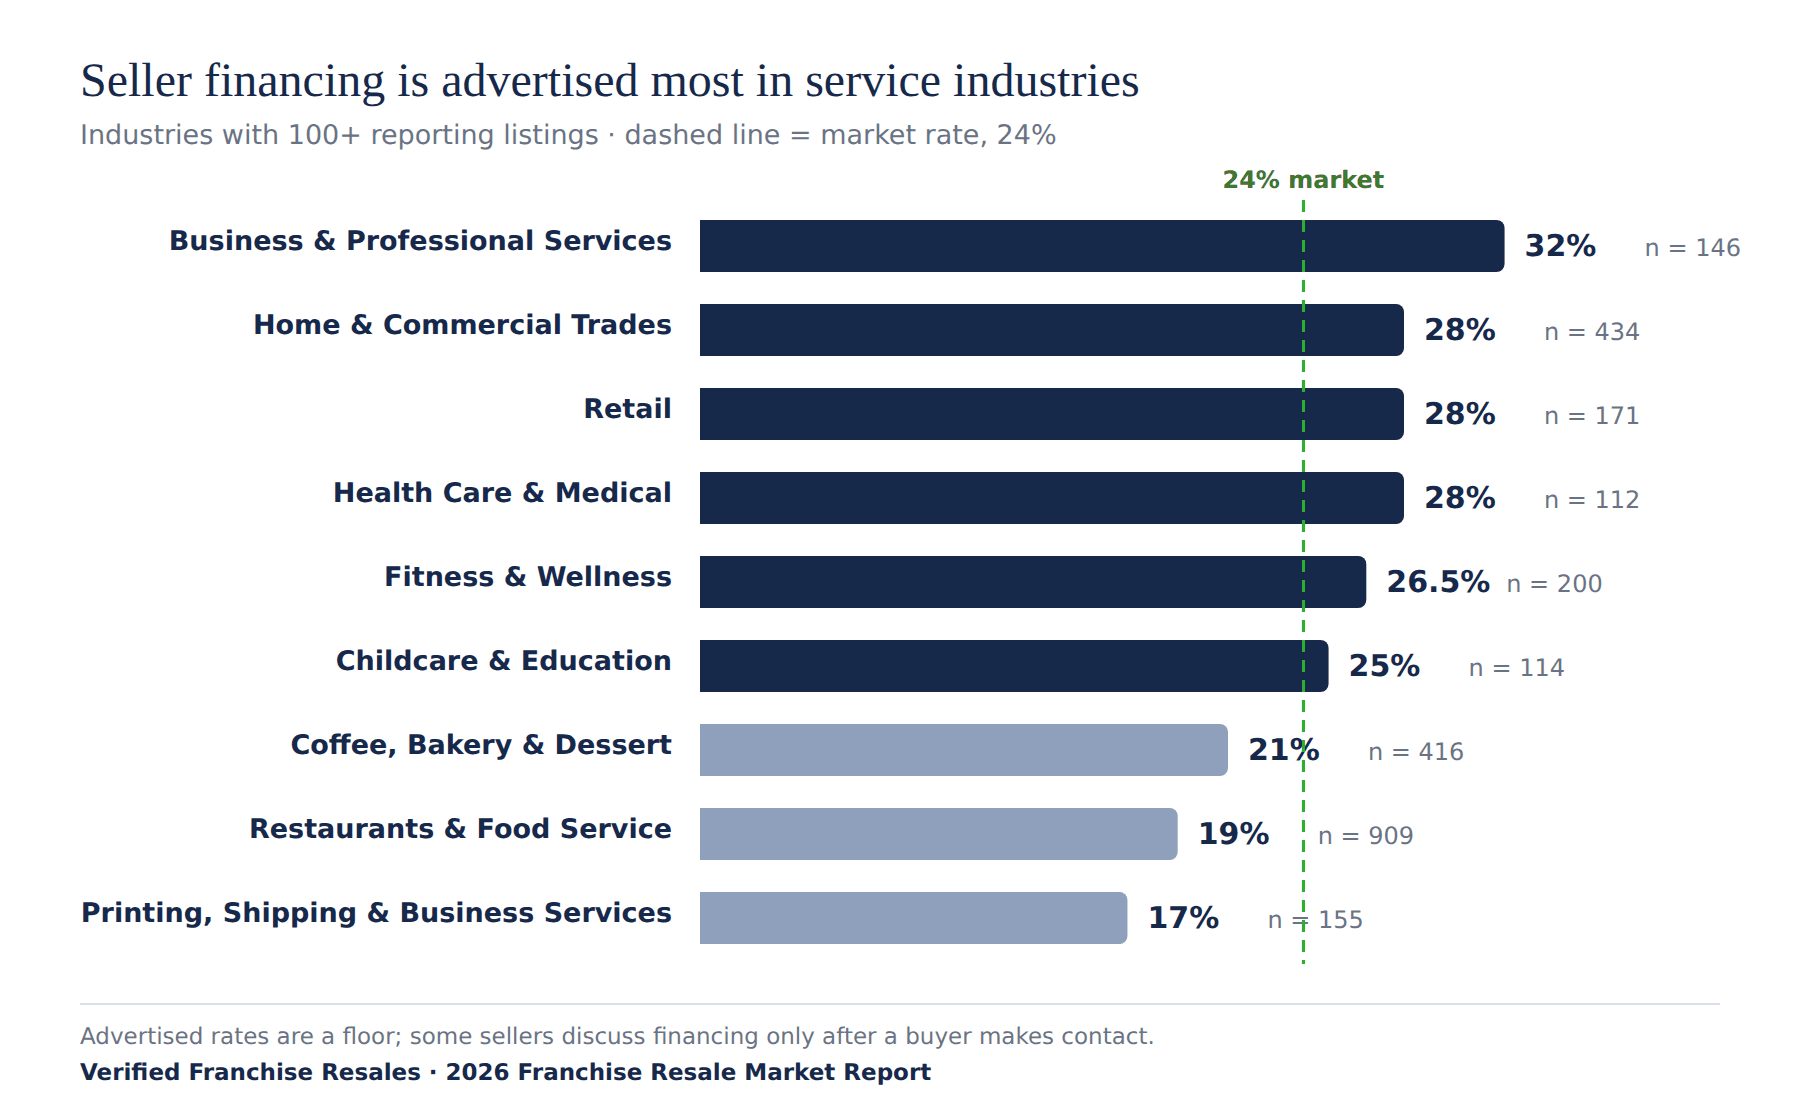
| Industry | Advertise seller financing | Listings |
|---|---|---|
| Business & Professional Services | 32% | 146 |
| Home & Commercial Trades | 28% | 434 |
| Retail | 28% | 171 |
| Health Care & Medical | 28% | 112 |
| Fitness & Wellness | 26.5% | 200 |
| Childcare & Education | 25% | 114 |
| Coffee, Bakery & Dessert | 21% | 416 |
| Restaurants & Food Service | 19% | 909 |
| Printing, Shipping & Business Services | 17% | 155 |
These advertised rates should be treated as a floor because some sellers discuss financing only after a buyer makes contact, which cannot be measured from listing language.
How often do existing franchise listings mention SBA financing?
In 2026, 8% of the 3,048 publicly listed existing franchises for sale in the reporting sample mentioned SBA financing or SBA pre-qualification, representing 255 listings.
The takeaway: SBA financing appears often enough in listing copy to be a meaningful buyer consideration, but this figure measures what sellers advertised, not how completed transactions were ultimately financed.
Why do franchise owners sell their businesses?
Retirement was the most common stated reason for selling an existing franchise in 2026, appearing on 713 of the 2,728 listings that stated a reason for sale, or 26%.
The takeaway: A franchise being for sale does not automatically signal a troubled business; retirement and a move to other business interests account for many stated exits.
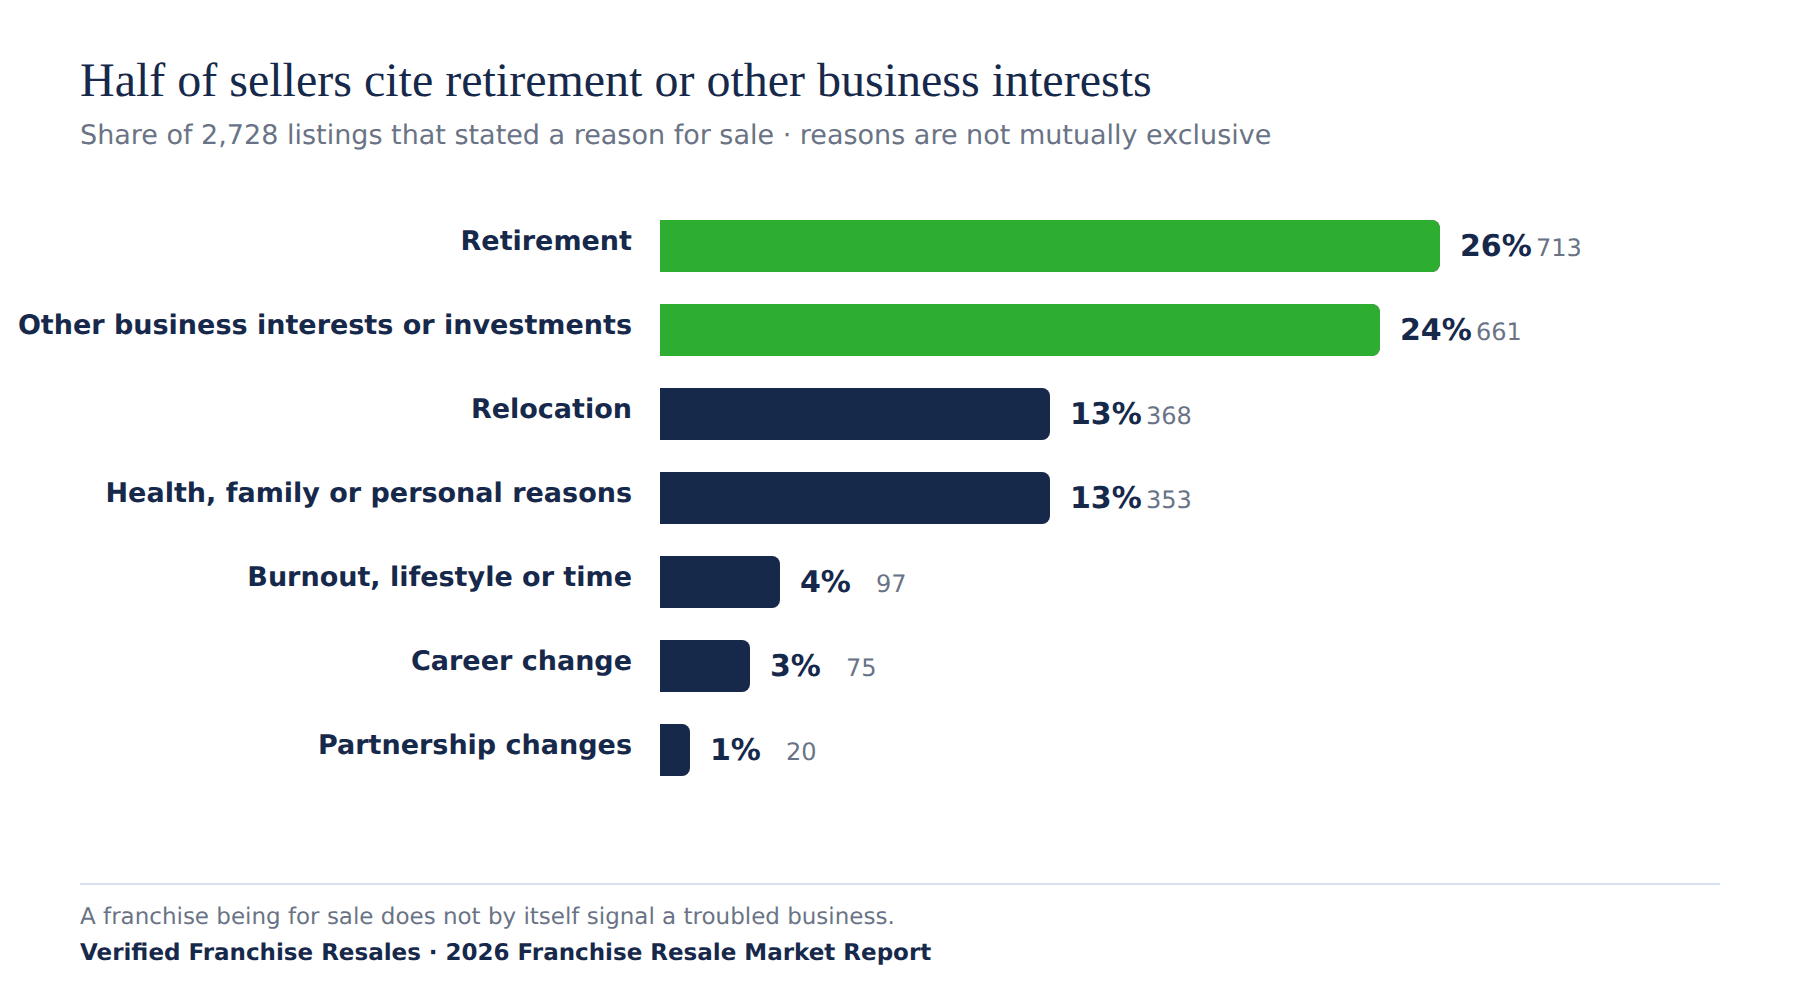
Among the 2,728 listings that stated a reason for sale in 2026, other business interests or investments were cited on 24% of listings, relocation on 13%, and health, family or personal reasons on 13%.
| Stated reason | Listings | Share of listings stating a reason |
|---|---|---|
| Retirement | 713 | 26% |
| Other business interests or investments | 661 | 24% |
| Health, family or personal reasons | 353 | 13% |
| Relocation | 368 | 13% |
| Burnout, lifestyle or time | 97 | 4% |
| Career change | 75 | 3% |
| Partnership changes | 20 | 1% |
How old are existing franchises when they are listed for sale?
The median existing franchise for sale in 2026 had been established for 8 years, based on 2,581 listings that disclosed a year established.
The takeaway: The typical business in the reporting sample was established, not brand new, which is one of the main distinctions between buying an existing franchise and opening a new location.
Among those 2,581 listings in 2026, 9% had been open less than three years, 47% had been open for three to nine years, 24% had been open for ten to nineteen years, and 21% had been open for twenty years or more.
Do larger franchise businesses have higher asking multiples?
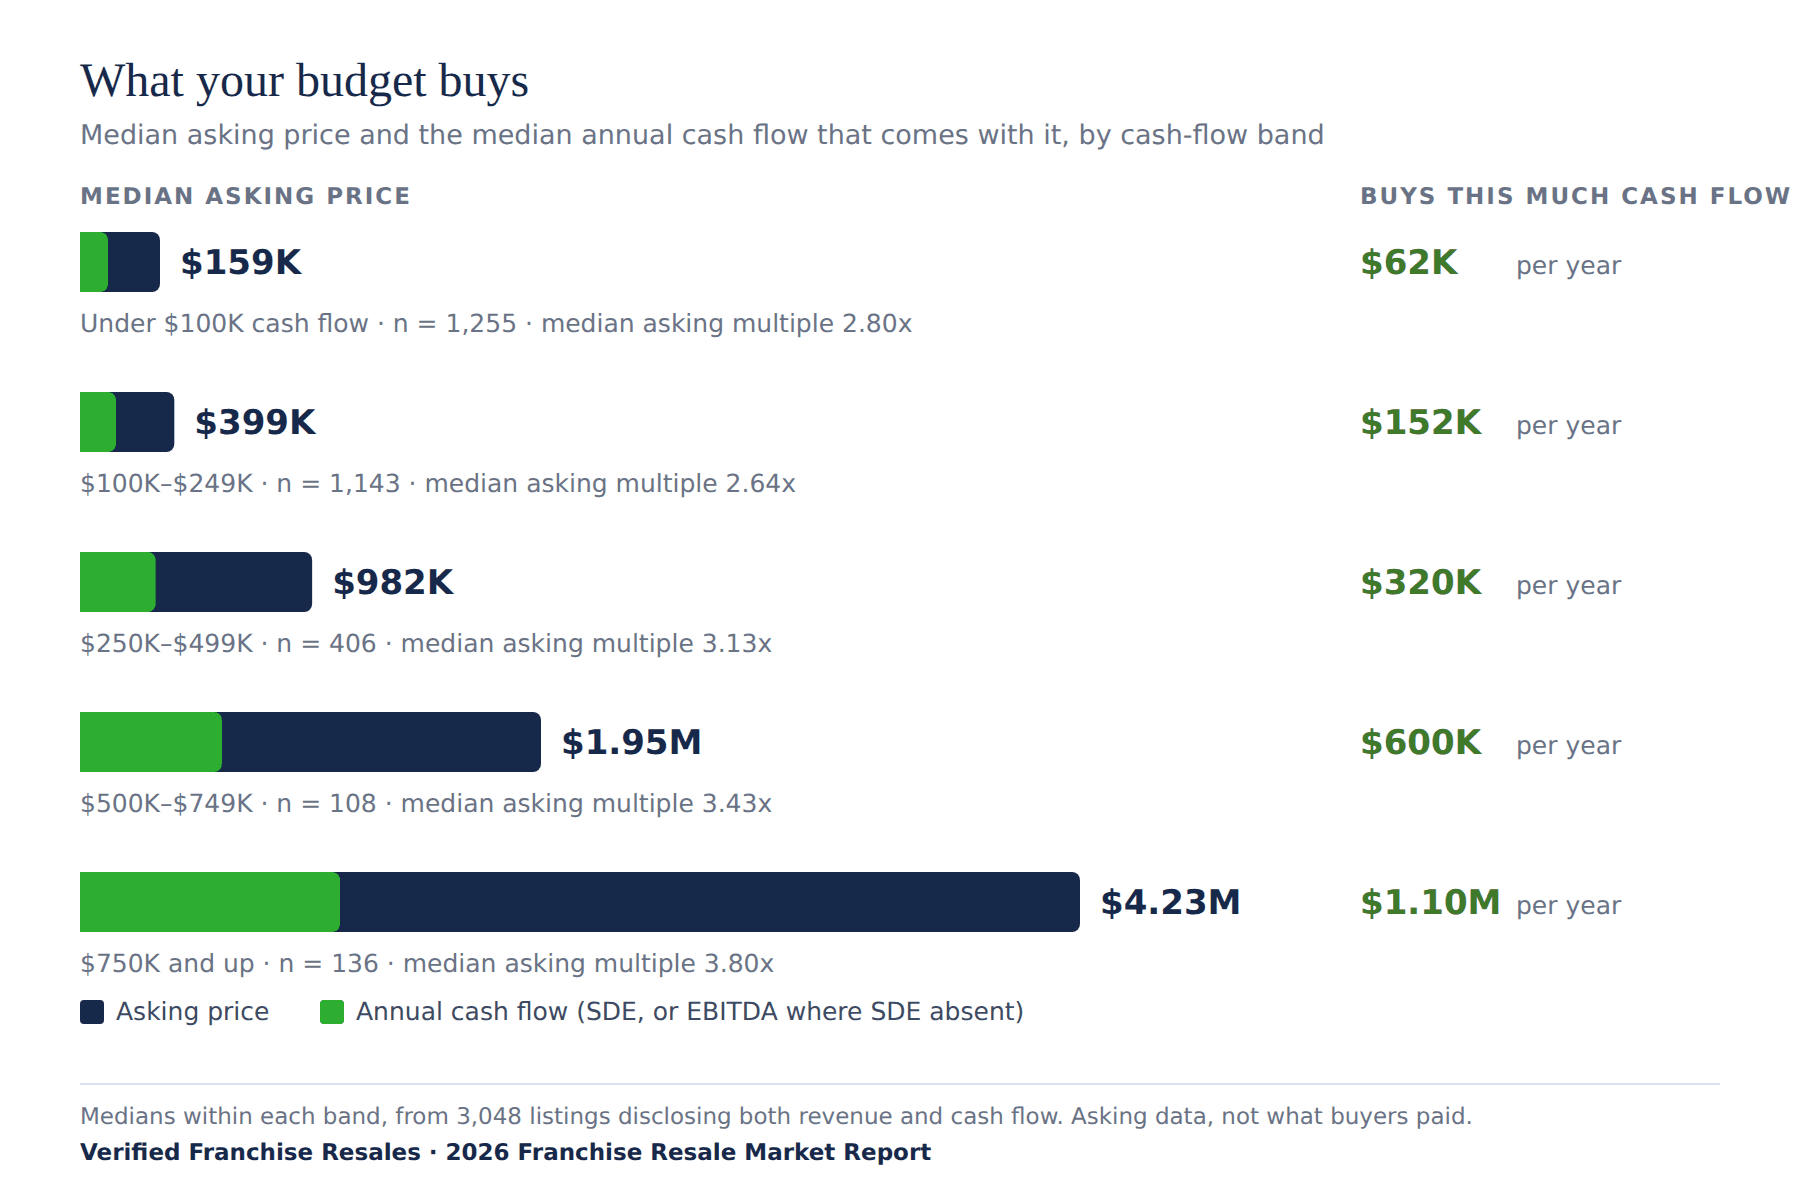
Yes: in 2026, the asking multiple generally increased as annual cash flow increased, based on the 3,048 listings in the core comparative sample and the qualifying listings within each cash-flow band.
The takeaway: Once annual cash flow moves above roughly $250,000, asking multiples begin to rise more clearly with business size.
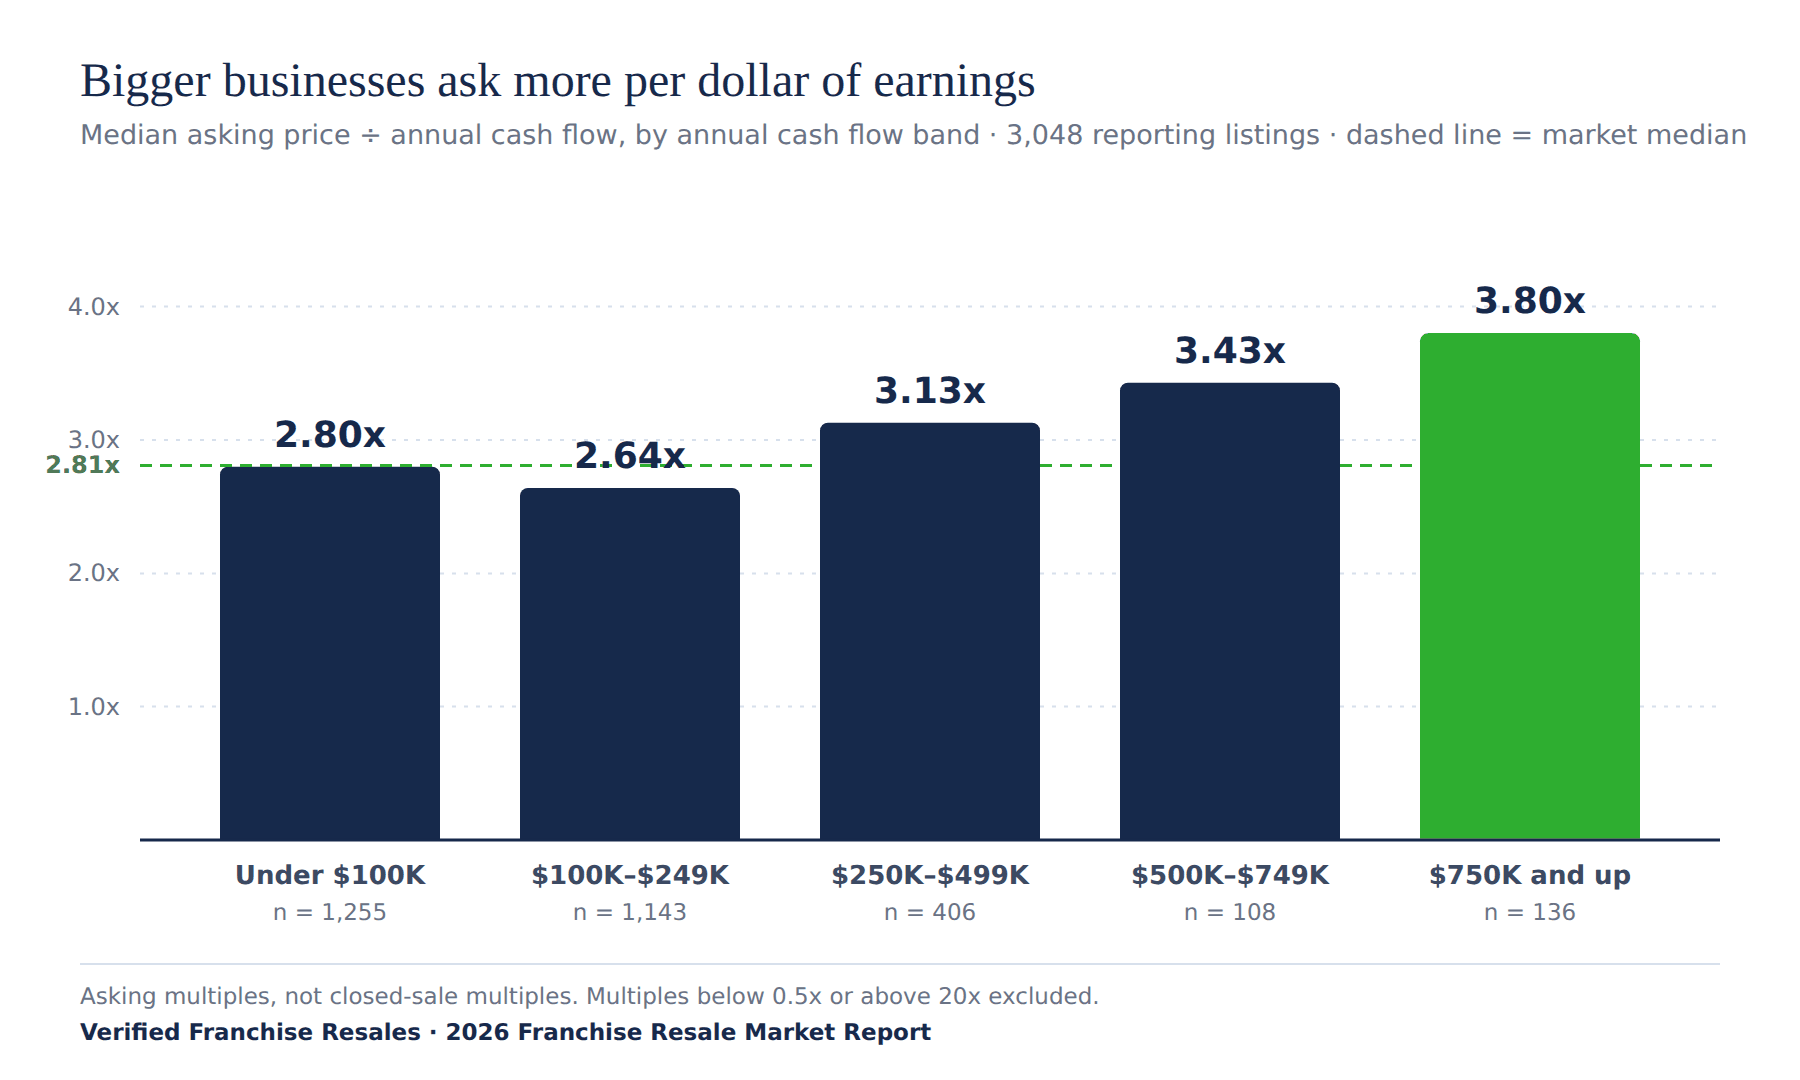
The surprise is not that bigger businesses cost more. The more useful finding is that larger businesses also tended to command a higher price for each dollar of earnings.
| Annual cash flow | Listings | Share | Median revenue | Median cash flow | Cash flow % of revenue | Median asking price | Median asking multiple |
|---|---|---|---|---|---|---|---|
| Under $100,000 | 1,255 | 41% | $387K | $62K | 14.7% | $159K | 2.80x |
| $100,000–$249,999 | 1,143 | 38% | $750K | $152K | 20.8% | $399K | 2.64x |
| $250,000–$499,999 | 406 | 13% | $1.54M | $320K | 22.0% | $982K | 3.13x |
| $500,000–$749,999 | 108 | 4% | $2.48M | $600K | 25.2% | $1.95M | 3.43x |
| $750,000 and up | 136 | 4% | $6.22M | $1.10M | 22.7% | $4.23M | 3.80x |
Most of the reporting market is still small: 79% of the 3,048 listings that disclosed both revenue and cash flow in 2026 reported less than $250,000 in annual cash flow.
The slight multiple bump in the smallest cash-flow tier looks more like a price floor than a true premium: equipment, buildout, leases and franchise rights can carry value even when owner earnings are modest.
Above $250,000 in annual cash flow, the pattern becomes much cleaner: larger businesses increasingly command a higher price for each dollar of earnings.
Which franchise industries have the most businesses for sale?
Among the 3,048 publicly listed existing franchises for sale that disclosed both revenue and cash flow in 2026, Restaurants & Food Service had the most listings at 909, followed by Home & Commercial Trades at 434, Coffee, Bakery & Dessert at 416, and Fitness & Wellness at 200.
The takeaway: Food dominates the number of publicly listed existing franchises for sale, while home and commercial trades lead the non-food side of the market.
Among the same 3,048 listings in 2026, Home & Commercial Trades was the largest non-food industry with 434 publicly listed existing franchises for sale.
Which franchise industries have the highest asking multiples?
Among the 13 industries with at least 50 publicly listed existing franchises for sale that disclosed both revenue and cash flow in 2026, the median asking multiple ranged from 2.59x for Home & Commercial Trades to 3.50x for Beauty & Personal Care.
The takeaway: Industry matters, but the spread between industries is smaller than the pricing difference between many small and large businesses.
| Industry | Listings | Median revenue | Median cash flow | Cash flow % of revenue | Median asking price | Median asking multiple |
|---|---|---|---|---|---|---|
| Beauty & Personal Care | 91 | $519K | $90K | 16.6% | $285K | 3.50x |
| Printing, Shipping & Business Services | 155 | $645K | $160K | 24.5% | $478K | 3.13x |
| Health Care & Medical | 112 | $954K | $158K | 19.3% | $421K | 3.03x |
| Automotive | 67 | $1.03M | $220K | 19.4% | $650K | 3.00x |
| Pet Services | 81 | $393K | $80K | 23.8% | $344K | 2.99x |
| Childcare & Education | 114 | $374K | $86K | 24.6% | $268K | 2.96x |
| Coffee, Bakery & Dessert | 416 | $538K | $101K | 18.1% | $295K | 2.80x |
| Restaurants & Food Service | 909 | $779K | $123K | 14.7% | $313K | 2.80x |
| Fitness & Wellness | 200 | $458K | $100K | 21.1% | $260K | 2.76x |
| Business & Professional Services | 146 | $552K | $138K | 28.9% | $399K | 2.73x |
| Retail | 171 | $599K | $101K | 16.2% | $277K | 2.69x |
| Cleaning Services | 84 | $432K | $97K | 25.5% | $237K | 2.62x |
| Home & Commercial Trades | 434 | $704K | $154K | 21.0% | $350K | 2.59x |
That spread matters, but the larger lesson is that business size creates an even wider pricing gap than industry alone.
Margins tell a different story from multiples. In 2026, Restaurants & Food Service reported the lowest median cash-flow margin among the major industries at 14.7% (n = 909 reporting listings), while Business & Professional Services reported the highest at 28.9% (n = 146 reporting listings).
In plain English, a business can keep more of every sales dollar without commanding a higher asking multiple. Buyers should evaluate both operating economics and valuation rather than assuming one predicts the other.
Which franchise industries have the highest cash flow margins?
In 2026, Business & Professional Services had the highest median cash-flow margin among the major franchise industries in this study at 28.9% (n = 146 reporting listings), while Restaurants & Food Service had the lowest at 14.7% (n = 909 reporting listings).
The takeaway: A higher cash-flow margin does not automatically produce a higher asking multiple. Operating economics and valuation need to be compared separately.
In the 2026 reporting sample, Cleaning Services reported a 25.5% median cash-flow margin, Childcare & Education reported 24.6%, and Printing, Shipping & Business Services reported 24.5%. By contrast, Retail reported 16.2% and Beauty & Personal Care reported 16.6%.
Which types of existing franchises have the highest cash flow and asking multiples?
Eleven franchise niches with at least 25 reporting listings exceeded the 2026 market medians for both annual cash flow ($124,592) and asking multiple (2.81x): Day Care & Preschools; Breakfast, Brunch & Diners; Shipping & Postal Centers; Home & Senior Care; Print, Promo & Marketing Services; Home Renovation & Remodeling; Burgers & Hot Dogs; Auto Repair & Service; Signs & Graphics; Cookie Shops; and Mexican & Tex-Mex.
The takeaway: The highest multiple is not always attached to the strongest operating economics, so buyers need to look past a single valuation number.
| Niche | Listings | Median revenue | Median cash flow | Cash flow % of revenue | Median asking price | Median asking multiple |
|---|---|---|---|---|---|---|
| Day Care & Preschools (Childcare & Education) | 26 | $2.01M | $500K | 23.8% | $2.56M | 5.17x |
| Breakfast, Brunch & Diners (Restaurants & Food Service) | 29 | $1.18M | $211K | 16.2% | $600K | 3.33x |
| Shipping & Postal Centers (Printing, Shipping & Business Services) | 89 | $630K | $162K | 26.1% | $500K | 3.27x |
| Home & Senior Care (Health Care & Medical) | 59 | $1.22M | $191K | 16.0% | $510K | 3.15x |
| Print, Promo & Marketing Services (Printing, Shipping & Business Services) | 40 | $644K | $139K | 20.3% | $350K | 3.09x |
| Home Renovation & Remodeling (Home & Commercial Trades) | 32 | $887K | $162K | 17.1% | $438K | 3.02x |
| Burgers & Hot Dogs (Restaurants & Food Service) | 54 | $1.15M | $179K | 13.7% | $472K | 3.01x |
| Auto Repair & Service (Automotive) | 37 | $1.03M | $160K | 21.2% | $495K | 3.00x |
| Signs & Graphics (Printing, Shipping & Business Services) | 26 | $739K | $163K | 19.5% | $450K | 2.91x |
| Cookie Shops (Coffee, Bakery & Dessert) | 65 | $1.17M | $228K | 17.6% | $599K | 2.89x |
| Mexican & Tex-Mex (Restaurants & Food Service) | 41 | $997K | $171K | 11.4% | $399K | 2.85x |
Two niches are especially worth separating from the headline ranking. Day Care & Preschools asked a median 5.17x in 2026 across 26 reporting listings, but the figure appears heavily influenced by larger businesses and owned real estate. Shipping & Postal Centers asked a median 3.27x with a 26.1% median cash-flow margin in 2026 across 89 reporting listings, and 72% of those listings were identified as The UPS Store.
Cookie Shops also stood out on earnings, with $227,735 in median cash flow in 2026 across 65 reporting listings, and 62% of those listings were identified as Crumbl. At the other end of the valuation spectrum, Restoration & Remediation paired $186,567 in median cash flow with a 2.63x asking multiple, while Painting Contractors paired $134,792 in median cash flow with a 2.24x asking multiple in 2026; each niche comparison uses at least 25 reporting listings.
Which states have the most existing franchises for sale?
Florida had the most existing franchises for sale in the 2026 core comparative sample with 383 listings, followed by California with 330 and Texas with 321.
The takeaway: Location changes the mix and economics of businesses more than it changes the typical asking multiple.
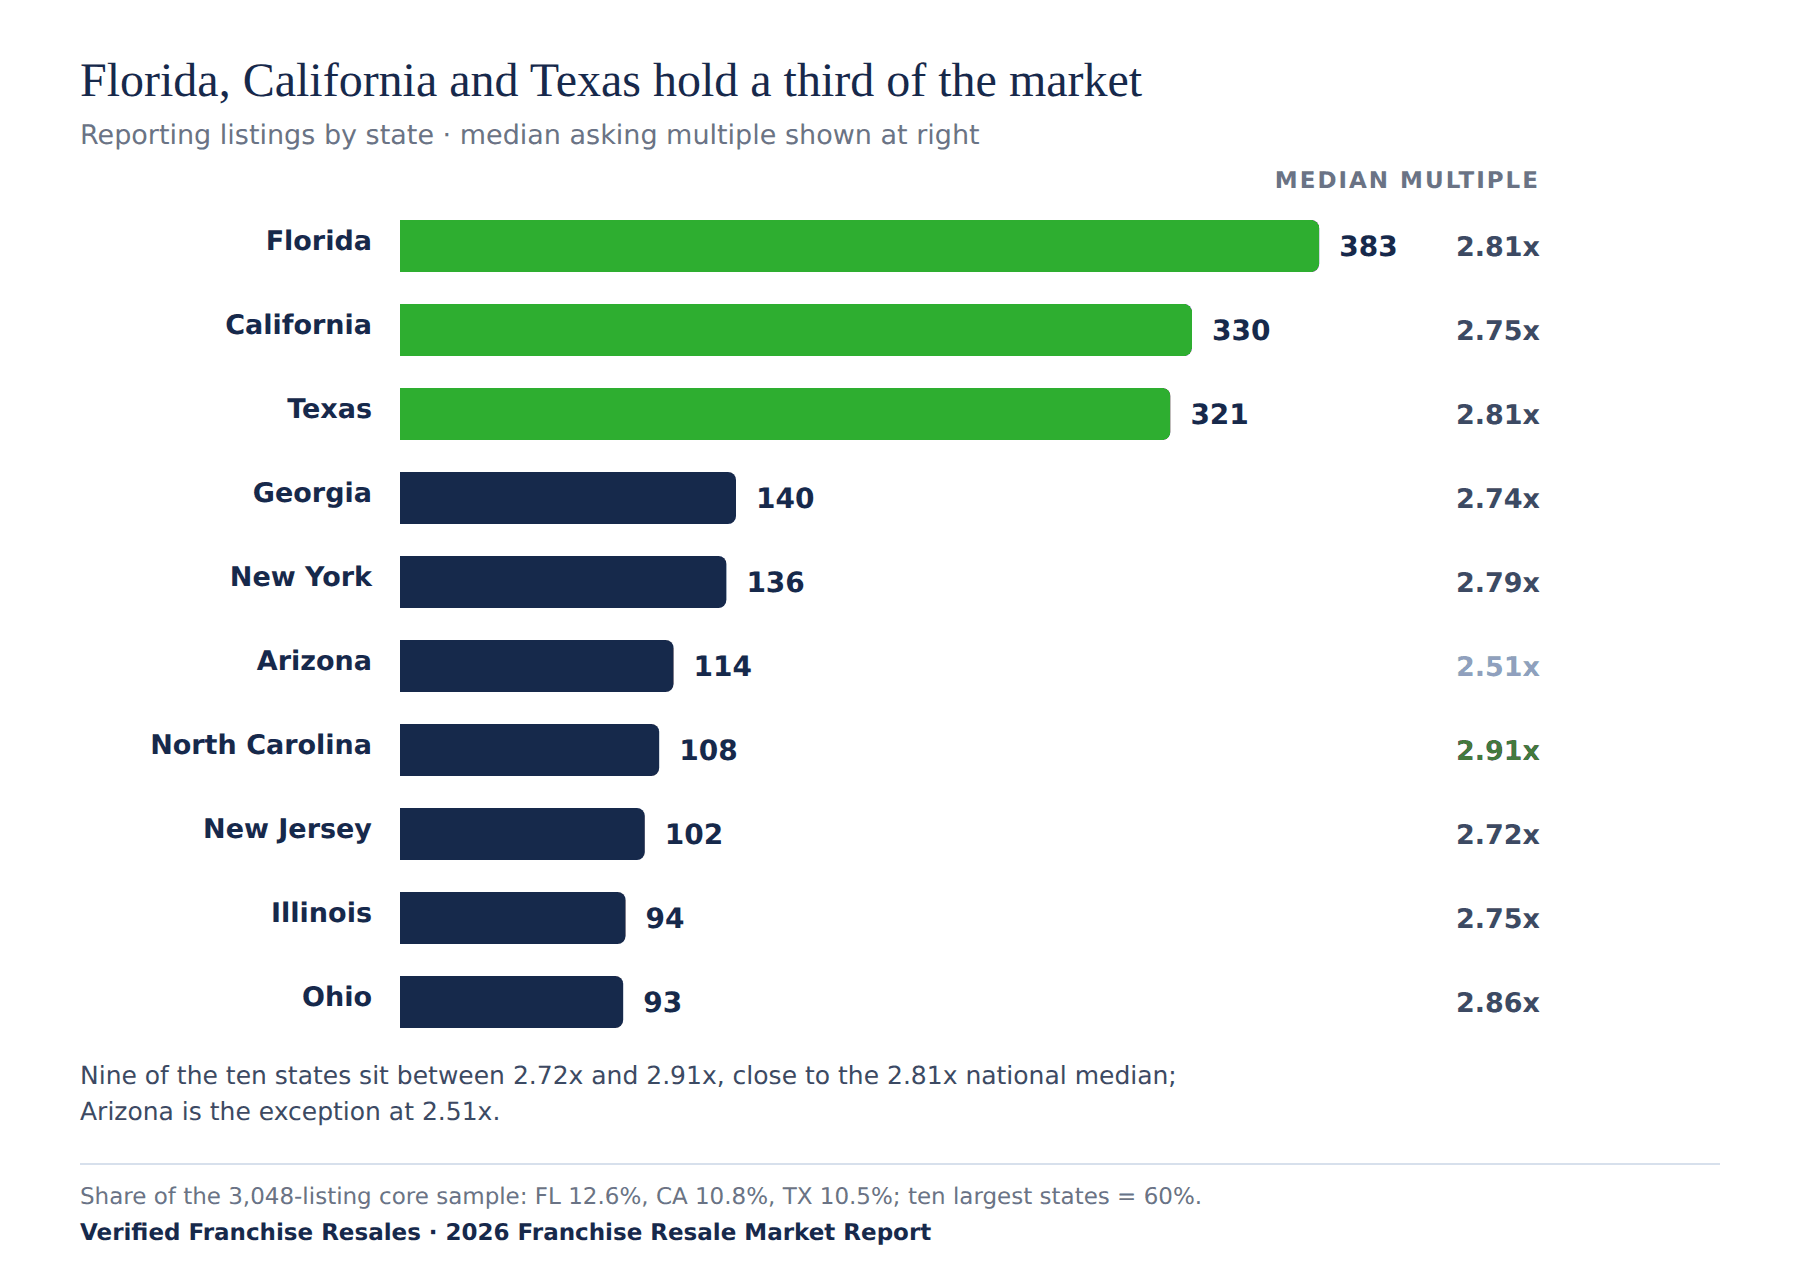
Florida, California and Texas together accounted for 34% of the 3,048 listings that disclosed both revenue and cash flow in 2026, while the ten largest states accounted for 60%.
| State | Listings | Share of U.S. listings | Median revenue | Median cash flow | Cash flow % of revenue | Median asking price | Median asking multiple |
|---|---|---|---|---|---|---|---|
| Florida | 383 | 12.6% | $664K | $121K | 18.9% | $315K | 2.81x |
| California | 330 | 10.8% | $650K | $118K | 16.5% | $325K | 2.75x |
| Texas | 321 | 10.5% | $610K | $121K | 20.6% | $322K | 2.81x |
| Georgia | 140 | 4.6% | $657K | $121K | 18.6% | $300K | 2.74x |
| New York | 136 | 4.5% | $648K | $136K | 18.7% | $350K | 2.79x |
| Arizona | 114 | 3.7% | $546K | $103K | 18.4% | $254K | 2.51x |
| North Carolina | 108 | 3.5% | $630K | $122K | 19.4% | $325K | 2.91x |
| New Jersey | 102 | 3.3% | $612K | $120K | 18.5% | $295K | 2.72x |
| Illinois | 94 | 3.1% | $609K | $103K | 15.9% | $282K | 2.75x |
| Ohio | 93 | 3.1% | $580K | $109K | 19.9% | $300K | 2.86x |
Among the ten largest states in the 2026 core comparative sample, nine had median asking multiples between 2.72x and 2.91x, close to the national median of 2.81x, while Arizona was the exception at 2.51x.
Among those same ten states in 2026, Illinois had the lowest median cash-flow margin at 15.9%, Texas had the highest at 20.6%, New York had the highest median asking price at $350,000, and Arizona had the lowest at $254,000.
Which franchise brands have the most existing locations for sale?
A franchise brand was identifiable on 790 of the 3,048 listings that disclosed both revenue and cash flow in 2026, or 26%, representing 337 distinct identifiable brands.
Among those 790 identifiable listings in 2026, Subway had the most units for sale at 67, followed by The UPS Store at 64, Crumbl at 40, Edible Arrangements at 18, Baskin-Robbins at 11, Papa John's at 11 and Papa Murphy's at 11.
The remaining 74% of the 3,048 reporting listings in 2026 did not name a franchise brand, so the brand counts describe identifiable listings only and should not be read as brand-level market share.
How often do franchise sellers reduce their asking price?
Among 2,300 publicly listed existing franchises for sale observed more than once from June through September 2026, 404 businesses, or 18%, reduced their asking price.
The takeaway: Asking prices are not fixed; a meaningful share of sellers adjusted their expectations during the collection window.
The median asking-price reduction among those 404 price-cut listings in 2026 was $50,000, or 17% of the first observed asking price.
Only 40 of the 2,300 repeatedly observed listings in 2026 raised their asking price, producing roughly ten price reductions for every increase.
How often do existing franchise listings leave the market?
Among the 2,247 core-sample businesses that were publicly listed for sale at the beginning of the collection window in June 2026, 28% were no longer listed by the end of the collection window in September 2026; because a removed business may have sold, expired or been withdrawn, the 28% figure is an inventory-turnover rate rather than a sales rate.
The takeaway: Listings leave the market quickly enough that a snapshot can go stale, but a removed listing should never be treated automatically as a completed sale.
Verified Franchise Resales identified 136 listings in the 2026 core sample that still displayed an active status even though the listing text or an earlier recorded status indicated the business was already under contract or sale pending.
Methodology
The 2026 Franchise Resale Market Report analyzes 5,692 publicly listed existing franchises for sale in the U.S. from June through September 2026, with a core comparative sample of 3,048 businesses that disclosed both annual revenue and annual cash flow. The reporting sample spans 17 industries, 175 represented niches within VFR's 186-niche taxonomy, 51 states and territories, and 337 identifiable franchise brands.
Source and study period. Verified Franchise Resales analyzed publicly available information for existing franchises offered for sale in the United States from June through September 2026. The report uses aggregate listing information and does not reproduce source listing pages.
What was excluded. Duplicate listings and records that did not represent comparable, operating U.S. franchise businesses for sale were excluded. This included independent businesses, franchise-development advertisements, route or vending opportunities, asset-only offerings, closed units and other non-comparable records. The final study dataset contains 5,692 publicly listed existing franchises for sale.
How the financial metrics were calculated. Asking price, revenue and cash flow are taken as stated by the seller or broker, and $0 values are treated as missing. "Cash flow" uses seller's discretionary earnings (SDE) when reported and EBITDA when SDE is unavailable. The asking-price-to-cash-flow multiple equals asking price divided by cash flow, with values below 0.5x or above 20x excluded from the multiple analysis; the reported multiple is the median across qualifying listings. Cash-flow margin is the median of each listing's cash flow divided by revenue.
What this data is—and is not. The figures in this report are listing and asking data, not closed-transaction data. The report describes how existing franchises were marketed for sale in 2026, not what buyers ultimately paid. A listing that disappears is not counted as a sale, original posting dates are unavailable, and seller-stated financial information has not been independently verified by Verified Franchise Resales.
Cite this report: Carpenito, D. (2026). 2026 Franchise Resale Market Report: Existing Franchises for Sale in the U.S. Verified Franchise Resales. https://verifiedfranchiseresales.com/reports/existing-franchises-for-sale
2026 existing franchise resale data at a glance
| Metric | Value | n | Definition |
|---|---|---|---|
| Publicly listed existing franchises for sale | 5,692 | 5,692 | Publicly listed existing franchises for sale included in the 2026 study |
| Reporting listings (core comparative sample) | 3,048 | 3,048 | Listings disclosing both revenue and cash flow |
| Share disclosing both revenue and cash flow | 54% | 5,692 | Core comparative sample ÷ all publicly listed existing franchises for sale |
| Combined asking prices | $2.2 billion | 2,980 | Sum of stated asking prices, reporting listings |
| Median asking price | $325,000 | 2,980 | Median stated asking price |
| Listings asking $500,000 or less | 68% | 2,980 | Share of reporting listings with a stated price |
| Median annual revenue | $655,478 | 3,048 | Median seller-stated annual revenue |
| Median annual cash flow | $124,592 | 3,048 | Median seller-stated cash flow (SDE, or EBITDA where SDE absent) |
| Median cash-flow margin | 18.6% | 3,048 | Median of cash flow ÷ revenue per listing |
| Median asking multiple (cash flow) | 2.81x | 2,957 | Median of asking price ÷ cash flow, 0.5x–20x |
| Median asking multiple (revenue) | 0.51x | 2,972 | Median of asking price ÷ revenue, 0.05x–5x |
| Broker-listed share | 77% | 3,048 | Reporting listings placed by a business broker |
| Owner-direct (FSBO) share | 17% | 3,048 | Reporting listings placed by the owner without a business broker |
| Franchisor-listed share (lower bound) | 3.0% | 3,048 | Reporting listings identifiable as franchisor postings |
| Owner-direct asking multiple (revenue) | 0.55x | 506 | Median asking price ÷ revenue, owner-direct listings |
| Broker asking multiple (revenue) | 0.50x | 2,294 | Median asking price ÷ revenue, broker listings |
| Listings advertising seller financing | 24% | 3,048 | Seller/owner financing mentioned in financing field, title or description |
| Most common stated reason for selling | Retirement (26%) | 2,728 | Share of reporting listings stating a reason |
| Median business age | 8 years | 2,581 | 2026 minus stated year established |
| Median employees | 7 | 1,124 | Stated number of employees |
| Listings with leased premises | 72% | 3,048 | Real estate field = Leased |
| Listings including owned real estate | 4% | 3,048 | Real estate field = Owned |
| Share of listings in Florida, California and Texas | 34% | 3,048 | Three largest states by reporting listing count |
| Listings that cut asking price | 18% | 2,300 | Reporting listings observed in 2+ pulls whose price fell |
| Median price cut | 17% | 404 | Median reduction as % of first observed price |
| Beginning-of-window businesses no longer listed by September | 28% | 2,247 | Core-sample businesses publicly listed for sale in June 2026 that were no longer listed by the end of the collection window in September 2026 (turnover, not sales) |
| Active listings already under contract or pending | 136 | 3,048 | Active status but under contract / sale pending per text or prior status |
| Identifiable brands | 337 | 790 | Distinct brands on the 26% of reporting listings naming one |
| Estimated share of franchise transfers publicly listed for sale | 15%–25% (estimate range) | — | VFR estimate from FRANdata transfer rate, IFA establishment count and publicly listed existing franchises for sale |
Limitations
- All financial figures in the 2026 report are seller- or broker-stated listing data rather than closed-transaction data, and Verified Franchise Resales did not independently verify the figures.
- The core comparative sample contains 3,048 of the 5,692 publicly listed existing franchises for sale observed in 2026 because only 54% disclosed both revenue and cash flow; that sample skews larger and more broker-listed than the full publicly visible inventory.
- The median asking price in the 2026 core comparative sample was $325,000 among 2,980 businesses with a stated asking price, compared with $250,000 across the broader dataset of 5,692 publicly listed existing franchises for sale, which illustrates the effect of the disclosure filter.
- The 2026 report covers the publicly visible market only, and the estimated 15% to 25% share of franchise transfers publicly listed for sale is an estimate range rather than a measured transaction share.
- Original posting dates were unavailable in the 2026 dataset, so the report does not measure days on market or time to sale, and a listing that disappeared is not counted as a completed sale.
- Franchise brands were identifiable on 790 of the 3,048 core-sample listings in 2026, or 26%, so the report does not present brand-level market share.
- The 2026 edition is a pooled three-month observation window rather than a multi-year time series, so no finding in this edition should be described as a trend; the headings and metric definitions are designed to be reused in future annual editions for year-over-year comparison.
About this report
The 2026 Franchise Resale Market Report is published by Verified Franchise Resales, a neutral marketplace for existing franchises for sale. Verified Franchise Resales does not broker, value or participate in transactions. The report is written by Dru Carpenito and is designed to be updated annually, with the current edition available from /reports/existing-franchises-for-sale. The web version is the canonical edition and is free to read without an email gate; any PDF version should be treated as a secondary copy.
Sources
- Verified Franchise Resales 2026 study dataset: 5,692 publicly listed existing franchises for sale analyzed from June through September 2026; 3,048 core-sample businesses disclosed both revenue and cash flow.
- Franchise Update Media, 2024 AFDR Data: What To Know About Franchise Resales.
- FRANdata / Franchise Update, Multi-Unit Ownership: QSR and Beauty-Related Concepts Lead the Charge (2024).
- FRANdata, 2024 franchise unit transfer rate (4.1%), presented at the Franchise Leadership & Development Conference (FLDC), Franchise Update Media, October 2025.
- International Franchise Association / FRANdata, 2025 Franchising Economic Outlook (830,876 U.S. franchise establishments in 2024).
Media Contact:
Dru Carpenito
Verified Franchise Resales
Email: dru@verifiedfranchiseresales.com